
Daiki Ito Oita Maizuru High School 29 August 2024
1. Curriculum Development
In developing the curriculum, the following four points were considered (Table 2):
- Based on the content of “Information Communication Networks and Data Utilization” in Information I and “Information and Data Science” in Information II, materials were developed to promote learning in “data-driven inquiry activities” (a two-year instructional framework). Specifically, themes for inquiry activities conducted in the second year were identified and enhanced by incorporating lessons from the experiences of past students and implementing improvements.
- To enable cross-disciplinary learning that integrates subjects like mathematics and inquiry activities, the curriculum aimed to handle data familiar to students, allowing knowledge to transfer effectively (mainly for Data Science Exercises and Statistics for Research Projects). For example, lessons incorporated data such as population statistics, convenience store sales, and lifestyle data like sleep duration.
- To avoid dependence on hardware or classroom environments, browser-based web applications were introduced to enable activities that could be performed on individual devices (mainly for Statistics for Research Projects, Global Data Science Inquiry, and Computer Science Exercises).
- In consideration of Information II and high school-university connections, materials that utilize machine learning were developed (mainly for Code Science Exercises II). For example, educational materials were designed to predict school satisfaction using data related to school life, such as sleep duration and participation in extracurricular activities.
Table 2: Curriculum Designed for Connection to Data-Driven Inquiry (SSH Special Subjects)
| Grade | Unit | Content |
| 1st Year: Data Science | ICT/Excel Exercise | Learn about the information society, the use of ICT, and methods for utilizing Excel. |
| Data Science Exercise | Conduct inquiry activities using statistical methods with familiar data. | |
| Code Science Exercise I | Conduct programming exercises that are easy to associate with concrete images. | |
| 2nd Year: SSH International Information (General Course) | Statistics for Research Projects | Learn statistical methods using multivariate data as the subject matter. |
| Computer Science Exercise | Learn about the workings of computers through hands-on experiences. | |
| Global Data Science Inquiry | Statistically process open data (Kaggle) and engage in independent problem-solving | |
| Code Science Exercise II | Explore methods of generalizing phenomena using Python. | |
| 2nd Year: SSH International Information (Science and Mathematics Course) | Statistics for Research Projects | Study statistical methods using multivariate data as a subject. |
| Computer Science Exercise | Learn about the workings of computers through experiential activities. | |
| Academic Writing Exercise | Create deliverables for research projects aimed at conference presentation level. | |
| Developer Coding Exercise | Learn engineering design practically through the development of web applications. | |
| Code Science Exercise II | Explore methods for generalizing phenomena using Python. |
2. Development of the Statistical Analysis Web Application “easyStat”
To support the teaching of the developed curriculum, a statistical analysis web application was created that is not influenced by environmental constraints. This application was designed to be used after statistical hypothesis testing in the first- year “Data Science Exercises”. During its use, datasets such as school life surveys (including variables like sleep duration and participation in extracurricular activities) were analyzed repeatedly to reinforce the statistical knowledge and skills taught in previous lessons. It was also employed in second-year subjects such as “Statistics for Research Projects” and “Global Data Science Inquiry” to enhance parallel inquiry activities.
Key Development Requirements for the Application:
- It should operate smoothly on tablet PCs or similar devices.
- It should minimize operations related to data processing.
- It should allow operation via touch only.
- It should include features to assist in data interpretation.
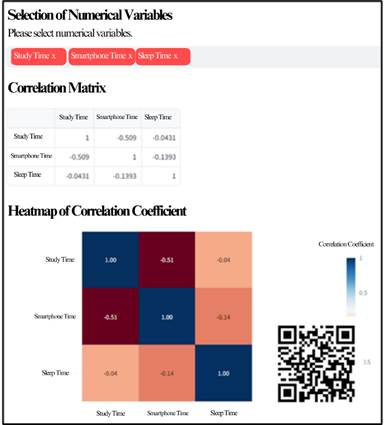
For requirement 1, the Ministry of Education’s “GIGA School Concept Standard Specification Guide (2020)” was referenced, and a browser-based web application that does not require installation was determined to be ideal. Therefore, the application was developed using Python with the Streamlit library, enabling data analysis on individual devices outside of computer labs, thereby reducing physical environmental constraints. For requirements 2 and 3, to reduce the complexity of statistical software operation—one of the barriers to statistical processing—the user interface was designed to function with simple touch operations, considering the ICT skill levels of high school students (Figure 1). Specifically, users can upload Excel files of data and perform analyses directly. In traditional information classes, teaching Excel operations can be time-consuming due to the wide variation in students’ skill levels. The more complex the processes, the greater the burden on teachers. However, this application simplifies visualization and hypothesis testing to a level where students only need to upload files and click or tap, significantly reducing the time needed for skill instruction and allowing more focus on tasks like interpretation and decision-making. For requirement 4, features were implemented to assist beginners in statistics, including functions to determine significance levels and provide interpretive support. This allows students with little knowledge of statistical processing and teachers with concerns about instruction to conduct analyses with ease. Additionally, the application incorporates statistical methods relevant to “Information I”, “Information II”, and potential inquiry activities, such as box plots, scatter plots (including matrices), correlation analysis, t-tests, ANOVA, and regression analysis.
Reference:https://huggingface.co/spaces/itou-daiki/easy_stat_demo
This web application is expected to support data-driven inquiry that is not constrained by time, space, or environment.
In the next section, I will discuss inquiry activities that utilize advanced technologies, including machine learning.